Some Thoughts on Using WinDbg
This is going to be a weird post.
After publishing Analyzing Estimates from the CSelCalcAscendingKeyFilter Calculator, I’ve had a couple of people express interest in some more details on how I used WinDbg to track down the details of that calculation.
This post aims to share the general approach I used, and some specific commands and techniques that I found helpful.
First Of All
I should start out by saying that using a debugger to try and understand a program for which you don’t have the source code is…really tedious. Being successful involves a lot of luck, a lot of detailed work, and a much smaller amount of skill 😜
This should never, ever be your go-to troubleshooting technique. There are lots of other things you can use to troubleshoot or learn about SQL Server: wait stats, DMVs, execution plans, SET STATISTICS IO and TIME, blog posts from Microsoft and knowledgeable community members, opening a support case, etc. I’m also quite partial to the documentation.
With all that out of the way, if you’re very curious about how something works in detail, or are desperate and have exhausted all other avenues, attaching a debugger might help you figure something out. Or it might end in frustration and futility.
Figuring Out Where To Start
I’m going to reference the above-mentioned blog post, so you may want to stop and read that before continuing on.
In my attempts to understand the cardinality estimate I was getting, I learned that it was being produced by a “calculator” called CSelCalcAscendingKeyFilter. This looks an awful lot like a C++ class name (the “C” prefix is pretty standard). I attached WinDbg to a local SQL Server 2017 instance (if you’re not familiar with that part, Erik Darling has a really straightforward guide on doing that) and searched for symbols with that name:
x /n sql*!*CSelCalcAscendingKeyFilter*
These are the results that came back (I’ve abbreviated them a little, because they all start with CSelCalcAscendingKeyFilter):
`vftable' = <no type information>
GetXmlDescriptionDetails (<no parameter info>)
FCalculate (<no parameter info>)
FStatsBased (<no parameter info>)
Print (<no parameter info>)
PopulateStatsCollection (<no parameter info>)
CSelCalcAscendingKeyFilter (<no parameter info>)
GetTelemetryPackageDescriptionDetails (<no parameter info>)
`vector deleting destructor' (<no parameter info>)
`scalar deleting destructor' (<no parameter info>)
PszName (<no parameter info>)
FCachedResult (<no parameter info>)
The thing that jumps out to me there is FCalculate (the “F” prefix stands for function - a function called “Calculate” on that class seems like the place I want to be), so that’s where I set my breakpoint:
bp sqllang!CSelCalcAscendingKeyFilter::FCalculate
You’ll notice I’m saying things like “jumps out at me” and “seems like.” As I mentioned before, I’m mostly making educated guesses with the information available and hoping it turns out right.
Stepping In
Requesting an estimated execution plan for this query, or just running it, causes the breakpoint to be hit.
You can press F11 to “step in” to the code. This will run one instruction each time you “step.” Here are a few lines from the beginning of FCaclulate:
00007ffc`9d7e47e0 488bc4          mov     rax,rsp
00007ffc`9d7e47e3 48895810        mov     qword ptr [rax+10h],rbx
00007ffc`9d7e47e7 57              push    rdi
00007ffc`9d7e47e8 4881ec90000000  sub     rsp,90h
The first 4 instructions there are related to starting up this function. What you’re looking at is an assembly instruction (mov, push, sub) followed by the arguments being passed to that assembly instruction.
There are lots of resources online for helping with understanding what specific instructions do. I have found this site to be useful. Also Google turns up lots of smart folks on Stack Overflow talking about assembly.
For example, the first instructions (mov rax,rsp) copies the contents of the CPU register rsp to another CPU register rax.
Some more general resources like x86 calling conventions can be helpful for understanding a broader view of how the different CPU registers are used.
Finding Parameters
Continuing on through the instructions for FCalculate, I came across this:
00007ffc`9d7e4811 488b4110 mov rax,qword ptr [rcx+10h]
This is copying a memory address into the rax register. The current value of rcx is 194298b7ec0 (that’s a pointer to an address in memory), and 194298b7ec0 + 10 (in hexadecimal, that’s what the h in 10h stands for) is 194298B7ED0 (you can find hex calculators online). An 8 byte address is being copied, so we can see that value with this command:
dq 194298B7ED0 L1
The output is
00000194`298cf5c0
If we let the code run, we can see that address get moved into rax by looking in the “Registers” window in WinDbg.
By convention, rcx is used to pass parameters into functions, so it’s worth looking at what we’ve got here.
One of my favorite WinDbg resources is Common WinDbg Commands (Thematically Grouped). Looking in section 18 on “Memory,” I see I can use the d command to display.
There are several formatting options for the d command. Since I expect we’re dealing with numeric parameters, I’m going to try one of the number formats (dD 298cf5c0):
00000194`298cf5c0      6.95263786904e-310     9.88131291682e-324     8.57630647116e-312
00000194`298cf5d8                       0     8.57630735676e-312     8.57630771494e-312
00000194`298cf5f0      1.18831764322e-312               -1.#QNAN     3.23792837921e-318
00000194`298cf608                       0     8.57630762324e-312                    300
00000194`298cf620                       3                      3                    150
It’s encouraging to see all numbers that I recognize here! In my testing, I know that some of the statistics-related values involved are 3 (the number of distinct values in the table), 300 (the number of rows in the table), and 150 (the number of modifications I had made to the table since statistics were updated).
The other values that look all weird are probably memory addresses or something, which don’t translate well to floating point values. Because, you know, they’re not =)
Mapping Things Out
It’s helpful to have that frame of reference. The parameters have been copied into rax. So when I see instructions like this:
00007ffc`9d7e4815 f2440f106070 movsd xmm12,mmword ptr [rax+70h] ds:00000194`298cf630=4062c00000000000
I know that a parameter is being copied into a floating-point register (xmm12), probably to be used in a calculation or comparison.
00007ffc`9d7e481b 66450f2fdc      comisd  xmm11,xmm12
00007ffc`9d7e4820 f2440f105058    movsd   xmm10,mmword ptr [rax+58h]
00007ffc`9d7e4826 730a            jae     sqllang!CSelCalcAscendingKeyFilter::FCalculate+0x52 (00007ffc`9d7e4832) [br=0]
This code compares that what’s in xmm11 to xmm12 (comisd) and says to jump to address 7ffc9d7e4832 if xmm12 is greater than or equal to (jae = jump if above or equal) what’s in xmm11.
It’s basically equivalent to if (xmm12 >= 0). The code also loads the table cardinality (300) into xmm10.
Whenever I came across branches like this, I did my best to go down the other branch at some point - in order to understand the different variations in the calculation. I used KDiff3 for that, here’s an example:
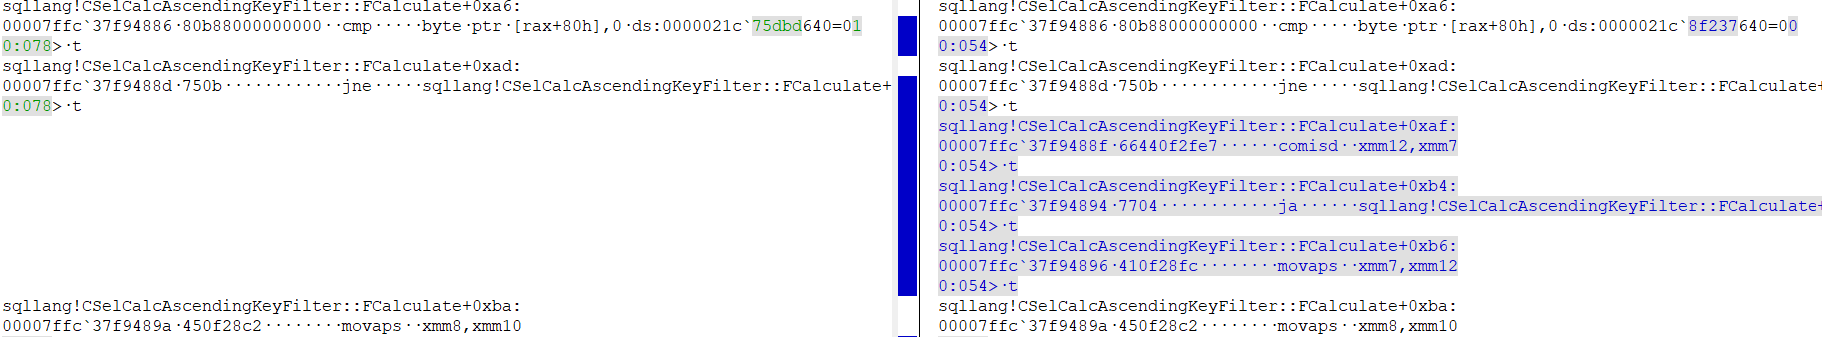
This branch is checking whether the parameter at rax+80h is zero or not. Through trial and error, I figured out that this parameter is non-zero when the statistics object in question are sampled (rather than fullscan). The right side is the code path runs if the stats are fullscan (it overwrites the density vector in xmm7 with the modification counter from xmm12).
Using diffs when triggering the code in different scenarios was really helpful in this case, as it helped me keep track of what values were being compared and stored in the different registers depending on the input parameters.
Noise and Other Patterns
I noticed this early on in the code, which grabs the floating point maximum and minimum values and stores them in registers:
00007ffc`37f9483d f2440f100dca7c5500 movsd   xmm9,mmword ptr [sqllang!_real (00007ffc`384ec510)]
00007ffc`37f94846 f20f1035ca7c5500   movsd   xmm6,mmword ptr [sqllang!_realffefffffffffffff (00007ffc`384ec518)]
These get used after basically every calculations for “bounds checking” - to make sure the result of the calculation is a valid float (not too large or small). That code looks like this:
00007ffc`37f94862 66440f2fcf         comisd  xmm9,xmm7
00007ffc`37f94867 720b               jb      sqllang!CSelCalcAscendingKeyFilter::FCalculate+0x94 (00007ffc`37f94874) [br=0]
00007ffc`37f94869 660f2ffe           comisd  xmm7,xmm6
00007ffc`37f9486d 7317               jae     sqllang!CSelCalcAscendingKeyFilter::FCalculate+0xa6 (00007ffc`37f94886) [br=1]
Prior to this, the result of a division calculation was stored in xmm7. So it gets compared to the valid min and max, and will jump to error handling code if a “bad” value is encountered.
Eventually it becomes easy to recognize this “boilerplate” code, but it is definitely distracting, and can be hard to separate from the code that actually matters.
There’s also a lot of stuff at the beginning and end of a method that isn’t particularly interesting as far as the calculation goes (saving state, zeroing out registers, restoring state, setting return values, etc.). This is more “noise” that can be tough to filter out.
In Conclusion
I’m not going to go through line by line, especially as this is already pretty long (and a pretty niche topic too!). If you have any questions, let me know and I’m glad to try and help 😃
If nothing else, I hope you find this interesting - happy debugging, if you dare 😜