CXCONSUMER As a Sign of Slow Parallel Joins
What does CXCONSUMER really mean?
For reference, here’s the description from the Microsoft Docs:
Occurs with parallel query plans when a consumer thread waits for a producer thread to send rows. This is a normal part of parallel query execution.
This wait was added (SQL Server 2016 SP2, SQL Server 2017 CU3) in order to try and make CXPACKET waits more actionable - these should be “benign” parallelism waits.
I’ve been curious about the CXCONSUMER wait type since I read Erik’s blog post about it, as well as a couple of questions on Database Administrators Stack Exchange that touched on it.
The common theme was skewed parallelism, so I decided to try and learn a little about when and where these waits are posted in queries that suffer from that particular malady.
A Bad Query™
I’m working with the 10GB, 2010 version of the Stack Overflow database. Some might describe this query as not very realistic:
SELECT *
FROM dbo.PostTypes pt
    INNER LOOP JOIN dbo.Posts p
        ON p.PostTypeId = pt.Id
    INNER JOIN dbo.Users u
        ON u.DisplayName = p.LastEditorDisplayName
WHERE pt.[Type] = 'TagWiki';
With a warm cache, this takes about 2 seconds on my laptop, and 0 rows are returned. This is what the wait stats look like on a typical run (from sys.dm_exec_session_wait_stats):
| session_id | wait_type | waiting_tasks_count | wait_time_ms |
|---|---|---|---|
| 53 | CXCONSUMER | 40294 | 6576 |
| 53 | CXPACKET | 37856 | 2379 |
| 53 | MEMORY_ALLOCATION_EXT | 10127 | 16 |
| 53 | SOS_SCHEDULER_YIELD | 366 | 1 |
| 53 | LATCH_EX | 5 | 0 |
| 53 | EXECSYNC | 1 | 0 |
| 53 | RESERVED_MEMORY_ALLOCATION_EXT | 652 | 0 |
| 53 | SESSION_WAIT_STATS_CHILDREN | 1 | 0 |
6.5 seconds of CXCONSUMER waits seems like a lot for a 2 second query at DOP 4.
A Brief Tour of the Execution Plan
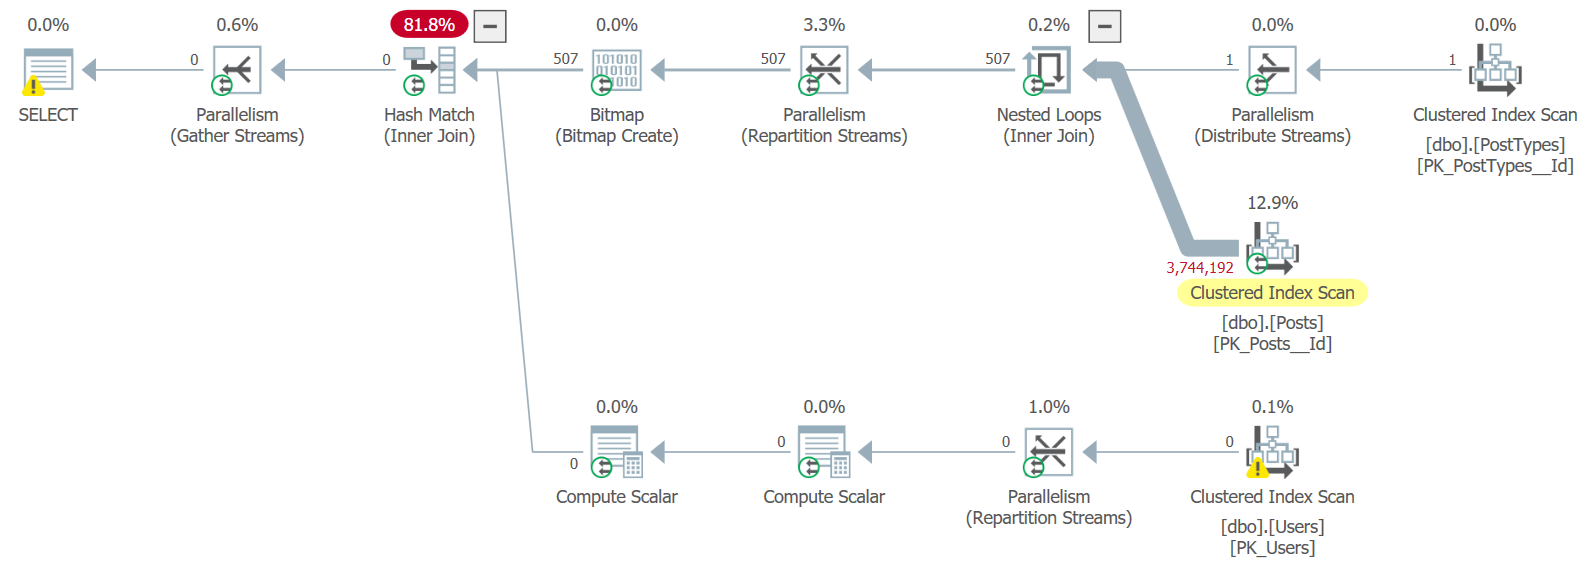
What makes this query so bad?
I’m forcing the join type, and implicitly forcing the join order, resulting in only one row coming into the outer input of the initial nested loops join. Even though the query is parallel, this causes all the matching rows to land on one thread - the thread with the single “TagWiki” row in PostTypes.
Tag Wikis are one of the least common types of posts, totaling 507 rows. But there are no indexes to support this query, so all 3.7 million rows in the Posts table are scanned. Fortunately, the table is only scanned once, because only one of the four threads gets a row that causes the inner side of the nested loops join to run.
The other three threads running in that parallel branch (between the left side of the Distribute Streams and the right side of the Repartition Streams) are shut down without really getting to do anything.
At this point, I think it’s important to note that the query has 3 parallel branches, which I’ve labeled below:
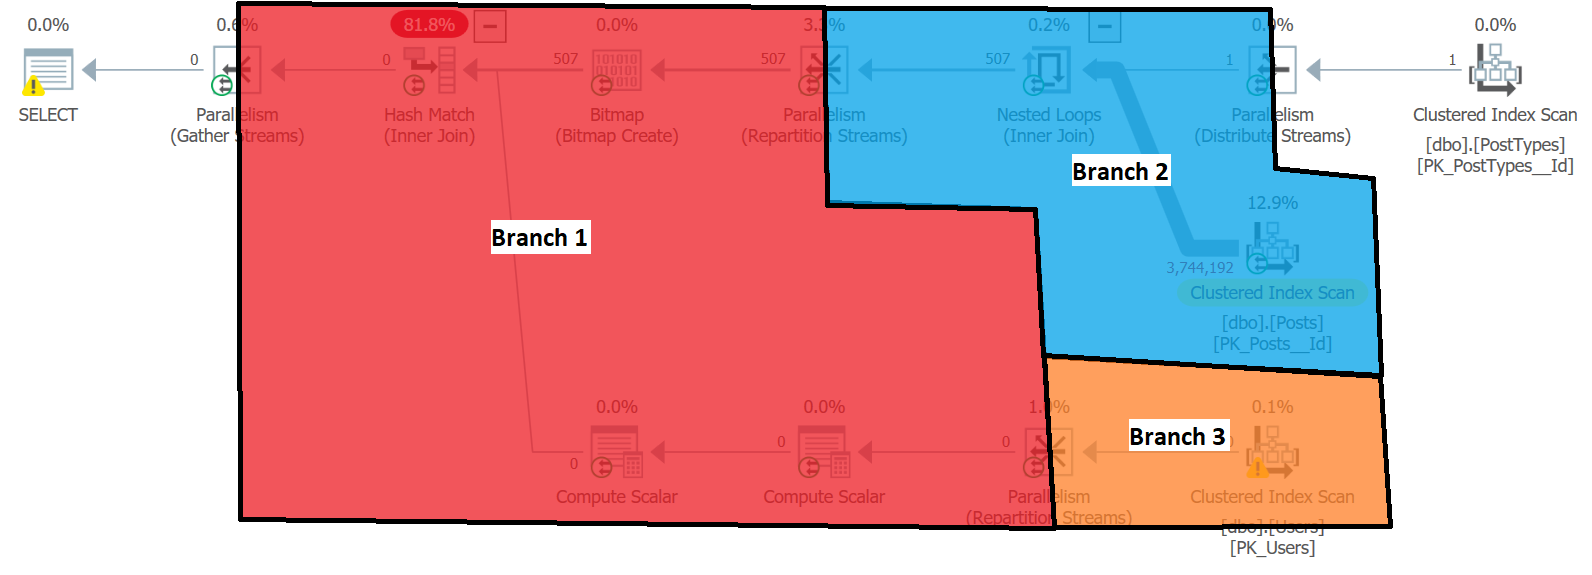
If you’re not familiar with branches in parallel execution plans, I’d highly recommend this perusing this post from Paul White: Parallel Execution Plans – Branches and Threads
So where does CXCONSUMER come into play here?
Extended events
I created this extended events session to capture waits occurring, scoped specifically to the session where I ran the query above:
CREATE EVENT SESSION [waits] ON SERVER
ADD EVENT sqlos.wait_completed(
    ACTION(package0.callstack,sqlos.scheduler_id,sqlos.system_thread_id,sqlos.task_address,sqlos.worker_address)
    WHERE (
        ([package0].[equal_uint64]([sqlserver].[session_id],(53))) AND (([duration]>(0)) OR ([signal_duration]>(0))))),
ADD EVENT sqlos.wait_info(
    ACTION(package0.callstack,sqlos.scheduler_id,sqlos.system_thread_id,sqlos.task_address,sqlos.worker_address)
    WHERE (
        ([package0].[equal_uint64]([sqlserver].[session_id],(53)))))
ADD TARGET package0.event_file(SET filename=N'waits')
WITH (STARTUP_STATE=OFF)
GO
Parsing through that event file with terrible XML queries, I can see long CXCONSUMER waits in the wait_completed event here:
| ts | event_name | wait_type | duration | task_address |
|---|---|---|---|---|
| 2019-04-11 02:42:51.900 | wait_completed | CXCONSUMER | 2151 | 0x00000289da04eca8 |
Since this fired at 51.900, and had a duration of 2151, I should be able to find the wait_info entry at 49.749. I found one for the same task_address at 49.750 (the difference is due to the way the datetime data type rounds to the nearest .000, .003, or .007 seconds):
| ts | event_name | wait_type | duration | task_address |
|---|---|---|---|---|
| 2019-04-11 02:42:49.750 | wait_info | CXCONSUMER | 0 | 0x00000289da04eca8 |
So I’ve found one of the tasks generating CXCONSUMER waits. How can I find out more information about it?
Waiting Tasks
I was advised to look in sys.dm_os_waiting_tasks while this query was running to try and get some more details about what was going on.
To do that, I started the code below in another query window right before executing the bad query, and cancelled it when the query was done:
DROP TABLE IF EXISTS #waiting_tasks;

SELECT TOP 0 ts = SYSUTCDATETIME(), *
INTO #waiting_tasks
FROM sys.dm_os_waiting_tasks;
GO

INSERT INTO #waiting_tasks
SELECT ts = SYSUTCDATETIME(), *
FROM sys.dm_os_waiting_tasks
WHERE session_id = 56;
GO 10000
This produced about 9,000 rows of waiting task information. The closest CXCONSUMER wait to 49.750 with that task address starts here:
| ts | waiting_task_address | exec_context_id | wait_duration_ms | wait_type | blocking_exec_context_id |
|---|---|---|---|---|---|
| 2019-04-11 02:42:49.7540572 | 0x00000289DA04ECA8 | 4 | 5 | CXCONSUMER | 7 |
Entries exactly like this continue to show up in the results, with duration increasing all the way to 2151:
| ts | waiting_task_address | exec_context_id | wait_duration_ms | wait_type | blocking_exec_context_id |
|---|---|---|---|---|---|
| 2019-04-11 02:42:51.8980533 | 0x00000289DA04ECA8 | 4 | 2151 | CXCONSUMER | 7 |
This is definitely the same wait as the one we found in the XE.
The “resource_description” column probably has the most interesting information in it:
exchangeEvent
id=Pipe289aeab1400
WaitType=e_waitPipeGetRow
waiterType=Consumer
nodeId=3
tid=3
ownerActivity=sentData
waiterActivity=needMoreData
merging=false
spilling=false
waitingToClose=false
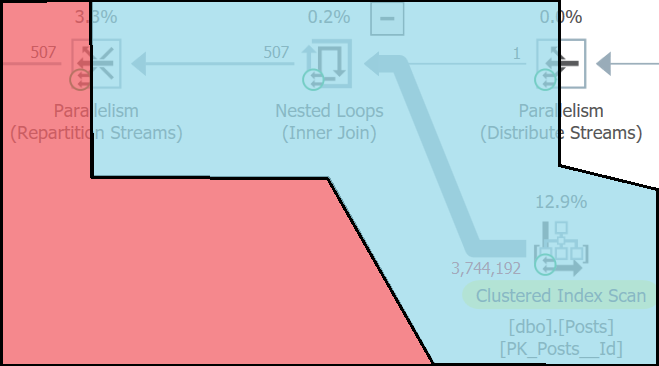
I may be stating the obvious, but this is a consumer thread, and it needs more data from the producer thread. So let’s zoom in a bit on that part of the plan.
Waiting for Rows to Repartition
Node ID 3 in the execution plan is the Repartition Streams operator to the left of the parallel nested loops join. Since this is consumer wait, this task represents one of the 4 threads running the branch labeled “Branch 1” - which is running on the left side of node 3 (the red branch).
The tid=3 represents thread id 3 in the execution plan. Threads 1 and 3 only got 2 rows each from the 507 rows that came out of the NL join. Threads 2 and 4 got more rows, although they also registered significant wait times during the times between getting rows. Here’s a breakdown of rows and threads for this operator in Plan Explorer:

Using this information, I can create a timeline of waits being registered by threads on the consumer (left) side of the Repartition Streams:
| tid | started | ended | duration |
|---|---|---|---|
| 1 | 49.7540572 | 51.9660535 | 2213 |
| 2 | 49.7540572 | 51.5220547 | 1775 |
| 2 | 51.5220547 | 51.9660535 | Lots of very short waits |
| 3 | 49.7540572 | 51.8980533 | 2151 |
| 3 | 51.9060622 | 51.9660535 | 66 |
| 4 | 49.7540572 | 51.5220547 | 1776 |
| 4 | 51.5260546 | 51.9660535 | Lots of slightly longer waits |
For the visual learners, here’s a graph! Each line is a thread, with the Y-axis representing the current CXCONSUMER wait duration at a given time, and the X-axis is time. This is scoped specifically to the consumer side of node 3.
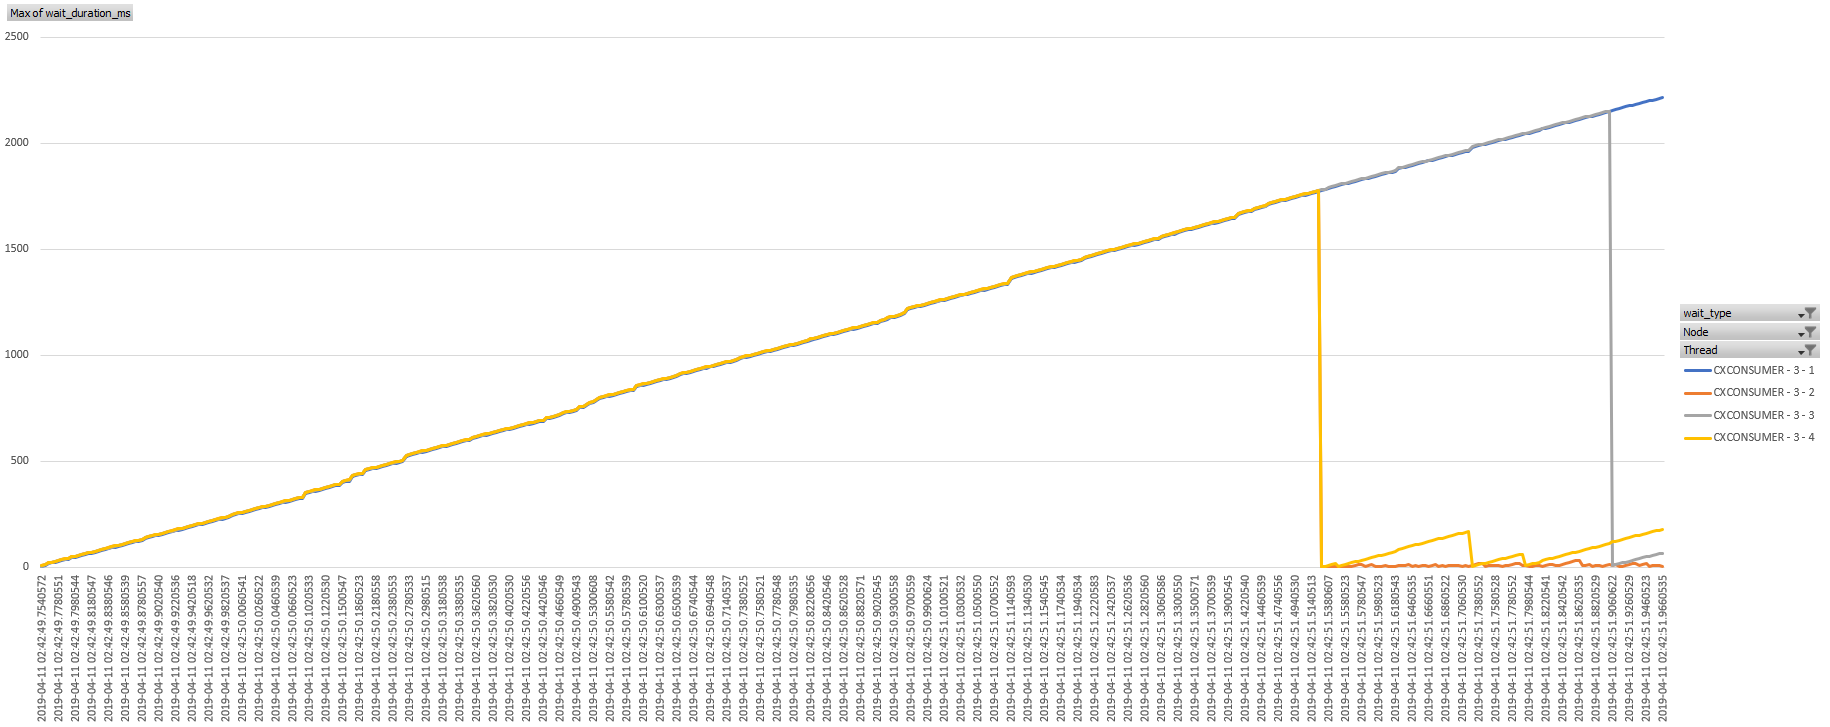
What Does It All Mean?
This demonstrates pretty clearly that threads that are attached to the consumer side of the Repartition Streams operator are registering CXCONSUMER waits while waiting on rows to be pushed across the exchange (node 3). The waiting issue is aggravated by the fact that rows aren’t pushed through the exchange one-at-a-time - a whole, page-sized packet of rows has to accumulate on the right side before it can begin to be consumed by the thread on the left side.
The producer threads are sending rows as quickly as they can from scan of the 3.7 million rows in the Posts table, but only a few rows qualify for the join condition, and only one thread is doing all the scanning. Thus it takes a long time for full “packets” of rows to build up on the right side of the exchange, and the threads on the left side are left waiting for work to do.
In this case, CXCONSUMER is not benign at all - but a sign that we have a query in need of tuning. There are several ways to “fix” this weird query with indexes and such, which are left as an exercise for the reader. It turns out that the “skewed parallelism” was less of a factor than the bad join condition, although the single-threaded “parallel” scan of Posts certainly contributed to the slowness of results arriving at the exchange.
Aside: About the Coordinator Thread
There is a very long CXPACKET wait that accumulates on the coordinator thread from 49.7460533 until 51.9700543 (2,224 ms) with a waiterType of “waitForAllOwnersToOpen.” This accumulates until all parallel branches in the plan have “started up.” It feels like this should logically be CXCONSUMER. Additionally, this specific CXPACKET wait seems harmless and unavoidable (which is funny, since CXPACKET is supposed to be the actionable wait now).
There is a CXCONSUMER wait that accumulates on the coordinator thread from 51.9740573 to 52.0460541 (71 ms). This shows that, once all the parallel branches have started up, thread zero acts like any other consumer when waiting on packets of rows at the left side of its Gather Streams operator.
Look Out for CXCONSUMER
This wait type can definitely be a sign that something strange is going on in your queries. Look out for poorly performing joins - particularly in cases like this, where a parallel exchange operator is active for a long time waiting on a long-running operator to send it data.
Note: I’d like to give a huge “thank you!” to Paul White (b|t) for reviewing the drafts of this post for technical accuracy related to parallelism in SQL Server, and for taking the time to help me gain an understanding of the details along the way - you’re awesome, Paul.