Using PerfView to Diagnose High CPU in an ASP.NET App
At work, I was recently faced with a puzzling issue with an ASP.NET application in a non-prod environment, and PerfView was critical in tracking down the problem.
Setup
A colleague reached out to me while they were doing some routine maintenance on a web server. One of our app pools was sitting at around 25-35% CPU usage, despite the fact that no one was using this particular application. They intended to restart the app pool, but asked if I wanted to check anything first.
In Comes PerfView
I got onto the server, took a trace using the default settings, and then pulled back the .zip file that was generated.
There are a number of ways to start reviewing one of these traces. I decided to go with a “top down” approach, which basically means looking at the CPU usage attributed to each thread:
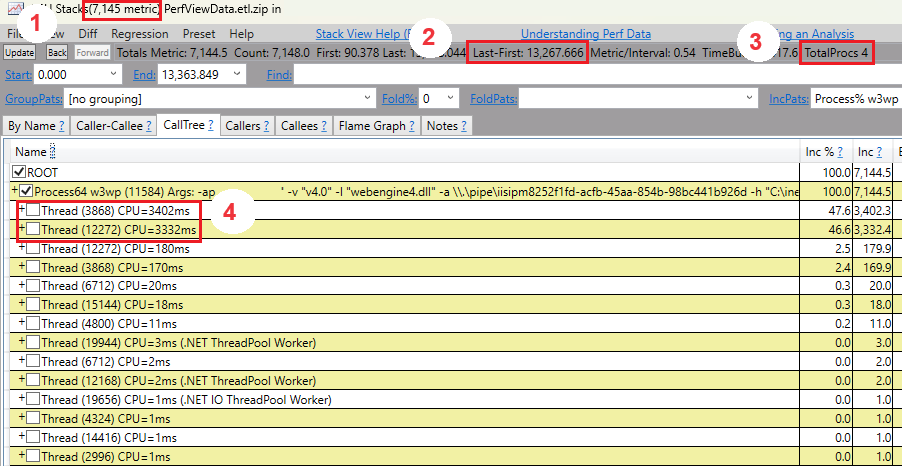
Here we can see that,
- We captured around 7,000 ms of CPU usage in this trace,
- The trace was around 13 seconds long,
- The server has 4 cores, and
- basically all of the CPU usage in the trace can be attributed to two threads.
I can now expand those two threads to see what stacks are “causing” the CPU usage.
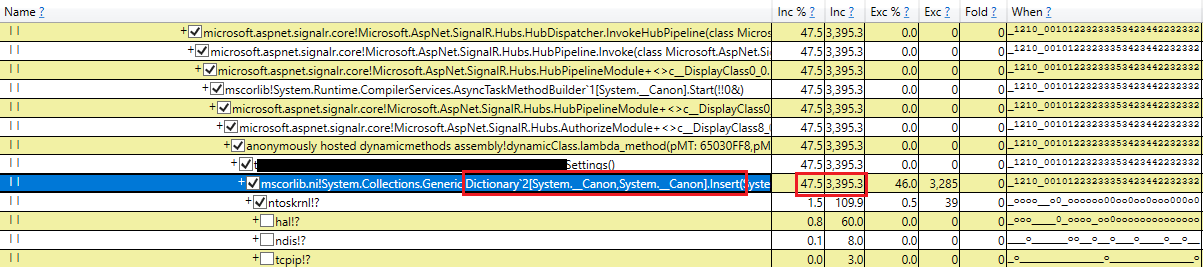
Drilling all the way down, I can see a specific method in our application code (which I’ve redacted) is trying to add an item to a static Dictionary<TKey TValue>. This looks essentially the same in both threads.
Those of you that have worked in .NET code may be getting the heebie jeebies already about that previous statement. That’s a “normal” generic dictionary that we are accessing from multiple threads.
For those that don’t know, writing to a generic dictionary in .NET is not thread safe. There is a specialized data structure for that (ConcurrentDictionary<TKey, TValue>), but that’s unfortunately not what we’re using here.
Resolution
Thanks to PerfView, we now know that this is a race condition - having multiple writers concurrently accessing a generic dictionary can lead to various problems. According to this Stack Overflow post, one possible reason for these threads that were “stuck” in the dictionary insert using CPU is that the linked list that backs the dictionary gets into a corrupted state. This leads to an infinite loop traversing the list trying to find where to add / update the entry.
The resolution is thankfully very simple - convert the Dictionary to ConcurrentDictionary.
Repeating the Problem
I wrote some code to try and repeat this problem in a small Console application. I wasn’t able to repeat the stuck thread / CPU usage issue, but I did encounter other issues. I ran the code below a number of times, and with minor tweaks to it. Depending on timing and resources, I ended up with “missed” keys (some additions to the dictionary were just silently lost) and errors (IndexOutOfRangeExceptions thrown on the data structures backing the dictionary).
This code should add exactly 20,000,000 items to a Dictionary.
var dictionary = new Dictionary<int, string>();

// Thread 1 adding 10,000,000 items to the dictionary
var threadOne = Task.Run(() =>
{
    for (int i = 0; i < 10000000; i++)
    {
        dictionary[i] = i.ToString();
    }
});

// Thread 2, also adding 10,000,000 items to the dictionary
// Note that they don't have any overlapping keys, so the
// dictionary should have exactly 20,000,000 entries in the end
var threadTwo = Task.Run(() =>
{
    for (int i = 10000000; i < 20000000; i++)
    {
        dictionary[i] = i.ToString();
    }
});

var done = false;
while (!done)
{
    // This part of the code just monitors the size of the dictionary,
    // and the state of the worker threads, once a second
    var previousCount = dictionary.Count;
    Console.WriteLine($"Dictionary contains {dictionary.Count} items");

    await Task.Delay(1000);

    if (threadOne.IsCompleted && threadTwo.IsCompleted) done = true;
}

Console.WriteLine($"Program Done, final dictionary count is {dictionary.Count}");
A typical run looks something like this:
Dictionary contains 0 items
Dictionary contains 1315751 items
Dictionary contains 2695424 items
Dictionary contains 3698120 items
Dictionary contains 5698725 items
Dictionary contains 6936593 items
Dictionary contains 9805390 items
Dictionary contains 11998949 items
Dictionary contains 12753095 items
Dictionary contains 15765002 items
Dictionary contains 18916222 items
Program Done, final dictionary count is 19546794
That’s 453,206 items that were lost due to using the Dictionary from multiple threads.
Replacing the Dictionary with a ConcurrentDictionary reliably results in exactly 20,000,000 items being added.
An Improvement in .NET 6
When I ran this sample code on .NET 6 (vs. the full .NET Framework), and I ran under the debugger, I encountered this error:
System.InvalidOperationException: ‘Operations that change non-concurrent collections must have exclusive access. A concurrent update was performed on this collection and corrupted its state. The collection’s state is no longer correct.’
This is really helpful for early detection of this kind of problem.
Conclusion
Be careful of accessing Dictionary<TKey, TValue> from multiple threads in .NET. This can be tricky as applications evolve, because they might not initially be accessed concurrently. The consequences can be pretty severe - lost data, errors, frozen threads, etc.
If you’re using a static Dictionary, or find yourself changing a Dictionary to be static, you’re likely in a situation where you need to be using a ConcurrentDictionary instead.
Also, keep PerfView in mind for issues where you don’t have a debugger attached to a program, but need to track down mysterious CPU usage. Thanks to this trace, that bug can be fixed before making it to customers!