Unusual THREADPOOL Waits
I occasionally see (usually brief) THREADPOOL waits on systems that are really not all that heavily loaded. This is my investigation into why. Some might say I have too much time on my hands.
Before getting into these unusual THREADPOOL cases, let’s cover the normal ones.
Normal THREADPOOL Waits
My laptop has 6 physical cores, hyperthreaded to 12 logical cores. The default calculation for my SQL Server 2019 instance’s “max worker threads” (when that is set to 0) is 640. I can verify that by running Erik Darling’s nifty stored procedure sp_PressureDetector (GitHub link):
EXEC master.dbo.sp_PressureDetector @what_to_check = N'cpu';

You’ll also notice there are 33 threads active when my system is idle. Who knows what those sneaky threads are doing. Sneaky threads.
The idea behind THREADPOOL is that all 640 workers are busy, and any new query requests have to wait until one frees up.
I want use up all the remaining 607 threads, so I’ll start by running this in SSMS:
BEGIN TRANSACTION;

UPDATE dbo.Posts
SET Score = 100
WHERE Id = 12496713
I wrote this query that will use 25 threads and then get blocked by the UPDATE statement above:
SELECT COUNT_BIG(*)
FROM dbo.Posts p
    INNER JOIN dbo.Users u
        ON p.OwnerUserId = u.Id
OPTION
(
    MAXDOP 12,
    MERGE JOIN,
    USE HINT ('ENABLE_PARALLEL_PLAN_PREFERENCE')
);
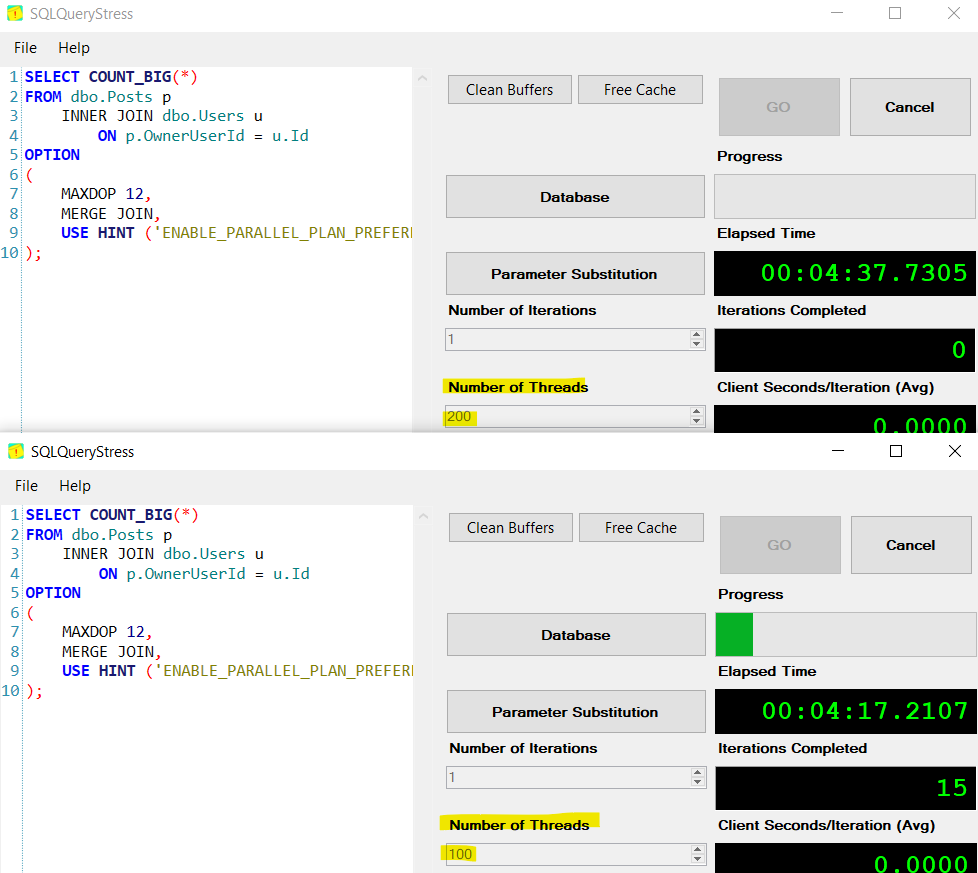
Finally, I used SQLQueryStress to run 300 instances of that query (I had to run 2 instances of the app, since the max value for threads is 200):
This results in THREADPOOL waits for the last several queries that came in, as you can see from the PerfMon counter “Waits for worker” (this is the “Waits in Progress” instance):
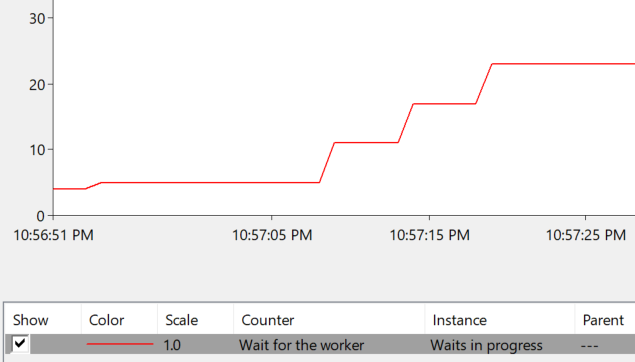
There are over 20 THREADPOOL waits in progress at this point. These queries are getting their feelings hurt, because it feels like SQL Server is ignoring them.
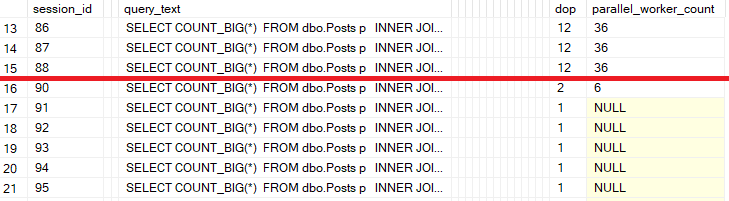
Sidebar: You might be wondering why I had to use so many instances of that query. SQL Server downgraded the degrees of parallelism for these incoming queries after the first several - everything after that dropped from DOP 12 to DOP 2 or DOP 1! So it took a lot more queries to get to the “max worker threads” limit.
You can see that happening in the last resultset for sp_PressureDetector’s cpu-related output:
Thanks to @erikdarlingdata for correcting me on this.
This is representative of one typical THREADPOOL scenario - a blocking chain that leads to many used threads (even though they are idle, and CPU usage on the system is low).
Unexpected THREADPOOL Waits
Now that we’ve seen the normal case, here’s the weird one.
I’m going to restart SQL Server, and then run this query through SQLQueryStress on 20 threads, 10 times each:
SELECT COUNT_BIG(*)
FROM dbo.Posts
OPTION (MAXDOP 12);
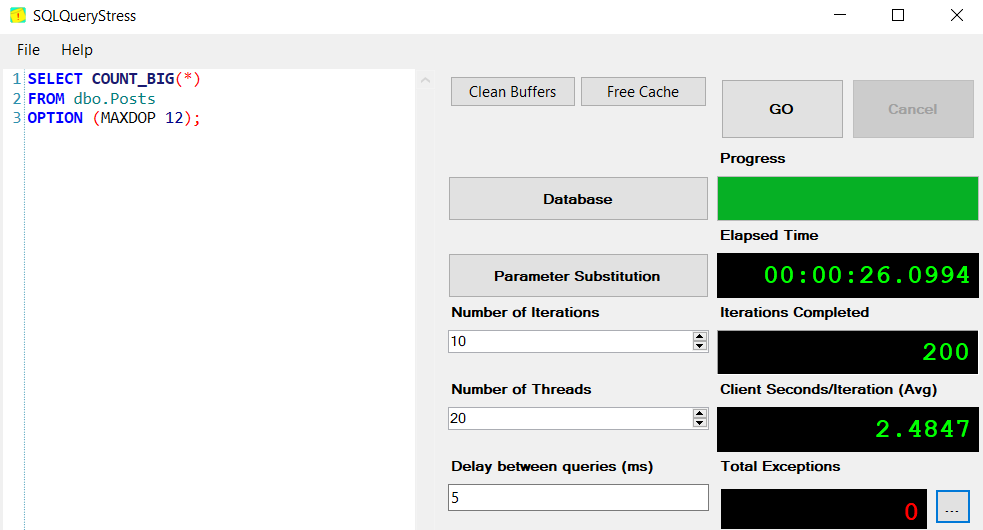
This shouldn’t come anywhere near the max worker threads limit, so no THREADPOOL waits are expected. As we all know, expectations and reality have a way of getting out of sync though 😀
I ran sp_BlitzFirst for 10 seconds during this workload, which captured 108 THREADPOOL waits, at 8.6 ms per wait:
EXEC master.dbo.sp_BlitzFirst @Seconds = 10, @ExpertMode = 1;

Directly after the call to sp_BlitzFirst was another call to sp_PressureDetector, to show that there was plenty of worker thread headroom (only 293 “used threads”), despite the ongoing queries coming in:

So what’s going on there?
Of Course I’m Quoting the Docs
The documentation has this to say about THREADPOOL:
Occurs when a task is waiting for a worker to run on. This can indicate that the maximum worker setting is too low, or that batch executions are taking unusually long, thus reducing the number of workers available to satisfy other batches.
That first sentence is interesting.
If I check the PerMon counter “Process” -> “Thread Count” for my local SQL Server instance when it has been idle for a while, it shows a steady value of a little over 100.
This seems logical to me - like many resources, SQL Server doesn’t proactively allocate a bunch of worker threads on startup. Instead, it allocates them when they are needed (kind of like the “min server memory” setting).
If I collect that PerfMon counter alongside “Wait for worker” -> “Waits started per second” while running that workload, the picture starts to become clearer:
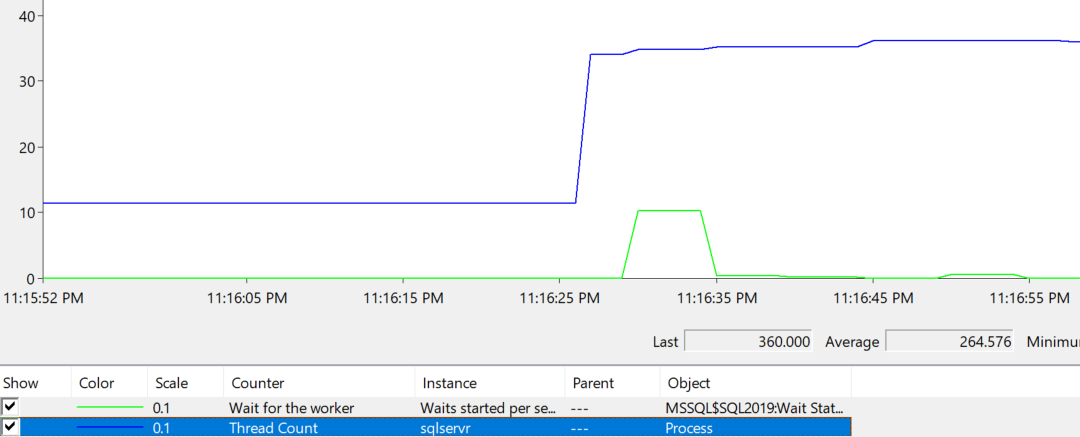
A couple of notes on that graph:
- Both counters are scaled by .1
- There is a spike in
THREADPOOLwaits starting (around 100) while the process’s thread count climbs from ~100 to over 300 - Smaller spikes in waits starting continue to occur as the workload progresses and SQL Server incrementally requests a few more threads
In running various tests, I observed that these “unusual” THREADPOOL waits were consistently correlated with SQL Server requesting threads from the Operating System (Windows, in this case).
Sidebar: you might notice that the waits lag behind the thread count increase - I believe this is just the nature of those counters (“Process” is nearer to real-time than the SQL Server ones).
Thread Ramp Up Period
Going back to that docs link:
Occurs when a task is waiting for a worker to run on.
In the typical case, this is because we’ve reached the logical limit SQL Server has set for how many workers threads you can have at a time.
In the unusual case, the task is waiting for a worker because SQL Server is allocating the thread (requesting it from the OS) that is needed to back that worker.
This results in a sort of “thread ramp up period” - until SQL Server has acquired all the threads it needs, you’ll see brief THREADPOOL waits while those threads are allocated. Once enough threads are allocated in the process to service the workload, the waits go away.
If the system is idle for a period of time, the threads are deallocated and returned to the OS. So this “thread ramp up period” could occur many times if your server has idle periods.
Conclusion
It’s possible to see brief THREADPOOL waits while threads are being requested from the OS, even when the system is well below the “max worker threads” limit.
I haven’t see this “thread ramp up period” be the source of real problems in workloads - it’s more of a curiosity. If you have encountered this as a real problem, I’d be interested in hearing about it in the comments!