A Bug with AG Health Checks
I came across a bug in SQL Server 2016 where the Availability Group (AG) health check can get stuck in an infinite loop after removing and re-adding a database from an AG.
Unfortunately, I don’t know exactly what version this bug was introduced. I first noticed the problem on SQL Server 2016 SP2 CU7 GDR (13.0.5366.0). It may have existed before then, but I never encountered it.
Scenario
As a little bit of background, we’re talking about a 2-node sync AG with file share witness.
I was deploying a new version of an application to one of our non-prod environments. This process involves refreshing the non-prod database with the latest copy of production data, to make sure we don’t have problems when deploying to production later. The process, broadly speaking, goes like this:
- Connect to the current primary replica (SVR20 today)
-
Remove the database from the AG
ALTER AVAILABILITY GROUP [myAgName] REMOVE DATABASE [MyDatabaseName]; - Drop the database, then restore it from the latest production (full and log) backups
-
Add the database back to the AG
ALTER AVAILABILITY GROUP [myAgName] ADD DATABASE [MyDatabaseName]; - Connect to the secondary replica (SVR19)
- Restore the latest production (full and log) backups over the database
WITH NORECOVERY -
Join the database back to the AG
 ALTER DATABASE [MyDatabaseName]
 SET HADR AVAILABILITY GROUP = [myAgName];
When bad things happen (which is about 15% of deployments right now, or 1-2 out of every 10):
- Both AGs go into the RESOLVING state at step 4
- CPU usage increases (and remains higher than usual) on SVR20 (the primary replica)
- Step 7 fails with this error message:
The connection to the primary replica is not active. The command cannot be processed.
A more detailed error message is in the error log as well:
The local availability replica of availability group ‘myAgName’ cannot accept signal ‘JOIN_DB’ in its current replica role, ‘RESOLVING_NORMAL’, and state (configuration is in Windows Server Failover Clustering store, local availability replica has joined). The availability replica signal is invalid given the current replica role. When the signal is permitted based on the current role of the local availability replica, retry the operation.”
Resolving the Issue
The only way to resolve the issue is to reboot the server.
I tried restarting the SQL Service, but it just caused CPU usage to increase even more, and the service never restarted.
Investigation
Trying to view the state of AGs using SSMS (in the “Always On High Availability” -> “Availability Groups” folder in object explorer) kept timing out, so this wasn’t an option for troubleshooting.
Trying to check on the AG by querying the sys.dm_hadr_availability_group_states DMV directly was blocked indefinitely by the HADR_AG_MUTEX wait type, which showed up like this in the wait_info column of sp_WhoIsActive:
(203693ms)HADR_AG_MUTEX
Remote desktop-ing in to the primary, I saw that sqlservr.exe was using the equivalent of one processor core consistently. In my case, I was on a 2-core VM, so CPU was consistently at 50% utilization. However, there was no evidence (from within SQL Server) of what was using CPU.
I used PerfView to take a 30 second sample of call stacks, and this stack used almost exactly 30 seconds of CPU:
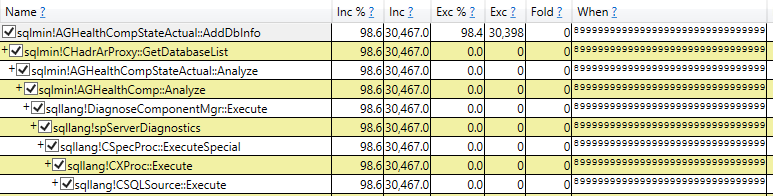
We’ll come back to that callstack (especially sqlmin!AGHealthCompStateActual::AddDbInfo) in a bit. But signs pointed to an infinite loop occurring in that method, which would be a bug.
Logs from a Repro
One instance of this problem occurred on 6/15. Here is the deployment log (from Azure DevOps) at step #4 mentioned above:
2020-06-15T19:51:20.4807394Z VERBOSE: Executing query: 'restore log [MyDatabaseName] with recovery;'
2020-06-15T19:51:20.6082707Z VERBOSE: Executing query: 'ALTER AVAILABILITY GROUP [myAgName] ADD DATABASE [MyDatabaseName];'
Note that the times above from DevOps are in UTC. The other times are local (EDT).
This correlates with an immediate disconnect from the AG in the SQL Server error log - connection to secondary terminated, transition to RESOLVING state:
6/15/2020 3:51:18 PM Always On Availability Groups connection with secondary database terminated for primary database 'MyDatabaseName' on the availability replica 'SVR19' with Replica ID: {f5ce3956-bfc9-4a37-91b5-113862d10c08}. This is an informational message only. No user action is required.

6/15/2020 3:51:52 PM Always On: The local replica of availability group 'myAgName' is preparing to transition to the resolving role in response to a request from the Windows Server Failover Clustering (WSFC) cluster. This is an informational message only. No user action is required.

6/15/2020 3:51:52 PM The state of the local availability replica in availability group 'myAgName' has changed from 'PRIMARY_NORMAL' to 'RESOLVING_NORMAL'.  The state changed because the availability group is going offline.  The replica is going offline because the associated availability group has been deleted, or the user has taken the associated availability group offline in Windows Server Failover Clustering (WSFC) management console, or the availability group is failing over to another SQL Server instance.  For more information, see the SQL Server error log, Windows Server Failover Clustering (WSFC) management console, or WSFC log.
In the WSFC cluster log, we can see that some heartbeats have been missed between the cluster and SQL Server.
2020/06/15-15:51:52.361 ERR   [RES] SQL Server Availability Group: [hadrag] Failure detected, diagnostics heartbeat is lost
2020/06/15-15:51:52.361 ERR   [RES] SQL Server Availability Group <myAgName>: [hadrag] Availability Group is not healthy with given HealthCheckTimeout and FailureConditionLevel
This is significant, as it gives us a clue about where the problem lies!
The heartbeat is driven by the WSFC side of things (the SQL Server resource DLL). And the “HealthCheckTimeout” is when the cluster resource reaches out to the primary to run sp_server_diagnostics and report back on the health of that SQL Server instance. See the table under Mechanics and guidelines of lease, cluster, and health check timeouts for Always On availability groups - Summary of Timeout Guidelines for the details.
As we saw earlier, the call to sp_server_diagnostics, specifically where it calls into GetDatabaseList and AddDbInfo, is stuck in an infinite loop (it’s running on one thread constantly using CPU). Thus it never responds to the health check. And it never will, until the service is restarted! From the same article:
When bringing the AG online as the primary replica, the SQL Server instance spawns a dedicated lease worker thread for the AG
This single thread is hosed, so the AG is also hosed.
Side note: this infinite loop also causes the blocking that prevents checking on the AG status, since only one thread can access this metadata at a time, and sp_server_diagnostics is stuck holding that mutex (HADR_AG_MUTEX).
The nail in the coffin of log messages is that the “IsAlive” check (one of the critical health checks in any cluster resource) reports failure:
2020/06/15-15:51:52.361 ERR   [RES] SQL Server Availability Group <myAgName>: [hadrag] Resource Alive result 0.
2020/06/15-15:51:52.361 WARN  [RHS] Resource myAgName IsAlive has indicated failure.
2020/06/15-15:51:52.361 ERR   [RES] SQL Server Availability Group <agTedsDBsUAT>: [hadrag] Lease Thread terminated
Root Cause
The PerfView sample I took indicates that there is an infinite loop going on in the “health check” that SQL Server does via sp_server_diagnostics - CPU and elapsed time were 1:1 inside the GetDatabaseList -> AddDbInfo method for the duration of the incident (until the server was rebooted). Perhaps, when removing and re-adding that database to the AG, there’s an edge case or race condition that causes it to “lose track” of that database.
This is basically keeping one thread / CPU core busy, and causing the health check to never return information to the cluster service.
I’m speculating at this point, but I think that part of the problem is that we’re running running 3 AGs that contain 4 total databases on a 2-core VM. Doing that is just asking for trouble (hey, it’s non-prod!). AGs use a lot of threads for a lot of different things. So some odd issues are to be expected.
I’ve reported the problem to Microsoft, and have been told it has been fixed in an upcoming CU. It still repros for me on SQL Server 2016 SP2 CU12 (13.0.5698.0). However, based on the timing of the communications, CU13 is the first one where I would expect to see the fix (the first item in the list mentions an access violation in sp_server_diagnostics, which is something I saw while creating the dump file, so I think it’s likely fixed there).
I intend to update this post once I’ve had a chance to test on that release.
Closing
There is a bug where SQL Server’s AG “health check” can get stuck in an infinite loop after removing and adding databases. In this case, the only recourse is to restart the server (or the service, if you can get it to restart). It’s possible this issue only affects systems with a low core count.
Hopefully it’s uncommon for this bug to impact production systems, as most folks are probably not removing and re-adding DBs to AGs all willy nilly in prod.
I believe there is a permanent fix for this bug in SQL Server 2016 SP2 CU 13, although I have not been able to test it yet.