Analyzing Estimates from the CSelCalcAscendingKeyFilter Calculator
Recently, I got curious about how estimates work outside of the histogram range - basically, where data has changed after statistics have been created, but before they’ve changed enough to trigger a statistics update.
I asked a question on DBA Stack Exchange about a particular query where I didn’t understand the estimate, and Forrest was able to figure out that it was the square root of the number of rows in the table. Thanks, Forrest!
Using the query_optimizer_estimate_cardinality extended event (thanks for all the blogging, Paul White!), I was able to determine that the weird estimate was coming from a “calculator” called CSelCalcAscendingKeyFilter.
The rest of this post is somewhat of a deep dive on how this calculator functions.
All of my testing was done on SQL Server 2017 CU15+GDR (KB4505225) - 14.0.3192.2.
Extended Events
I ran a modified version of Forrest’s repro, which goes like this:
-- Setup
USE TestDB;
ALTER DATABASE [TestDB] SET AUTO_UPDATE_STATISTICS OFF;
GO

DROP TABLE IF EXISTS dbo.Hist;

CREATE TABLE dbo.Hist
(
    ID int IDENTITY PRIMARY KEY,
    Num int
);

INSERT INTO dbo.Hist
SELECT TOP 300
    (ROW_NUMBER() OVER(ORDER BY(SELECT 1/0)))%3
FROM master..spt_values a
    CROSS JOIN master..spt_values b;

-- Get estimated plan
-- Don't forget to run right after setup to auto-create stats
SELECT *
FROM dbo.Hist
WHERE Num = 1000

--After stats have been created, add 150 more rows
INSERT INTO dbo.Hist
SELECT TOP 150
    -1
FROM master..spt_values a
The end result is a table with 450 rows, 150 of which were added after the initial statistics were generated. Getting the estimated plan after adding the extra 150 rows to the table results in this (abbreviated) XE output:
<CalculatorList>
    <FilterCalculator
        CalculatorName="CSelCalcColumnInInterval"
        Selectivity="-1.000"
        CalculatorFailed="true"
        TableName="[TestDB].[dbo].[Hist]"
        ColumnName="Num" />

    <FilterCalculator
        CalculatorName="CSelCalcAscendingKeyFilter"
        Selectivity="0.047"
        TableName="[TestDB].[dbo].[Hist]"
        ColumnName="Num"
        UseAverageFrequency="true"
        StatId="2" />
</CalculatorList>
I have the impression that CSelCalcColumnInInterval “fails” if the predicate doesn’t fall within any of the histogram intervals. The estimation logic then chooses to try the CSelCalcAscendingKeyFilter calculator (a reference to the “ascending key problem”) if the predicate is specifically higher than the last histogram interval.
You can see the estimate of 21.2132 rows in this screenshot:
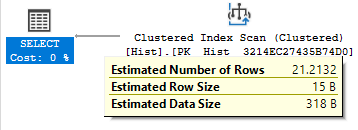
Multipling the selectivity of .047 by 450 (the number of rows in the table) is close to the estimate (21.15). The reason it’s not exactly right is because the selectivity in the XE output is rounded to three decimal places.
The real selectivity, which I’ll show further on in the post, is 0.0471404520791 (which multiplies out correctly to 21.2132 rows).
Definitions and Junk
My main goal here is to explain the different ways the “Selectivity” value is calculated by this…uh…calculator, and thus the different estimates you can expect from it.
As a point of reference, the setup steps produced these values in the statistics object:
DBCC SHOW_STATISTICS('dbo.Hist', [_WA_Sys_00000002_05D8E0BE]);

SELECT *
FROM sys.dm_db_stats_properties
(
    OBJECT_ID('dbo.Hist'),
    2
);
![[screenshot of statistics output][5]](https://joshthecoder.com/assets/2019-08-21-stats-info.PNG)
The relevant values I’ll be discussing are:
- Table Cardinality (TC) = 300 (the “Rows” column above)
- Distinct Values (DV) = 3 (1 divided by the “All Density” column above)
- Average Rows (AR) = 100 (TC divided by DV, the average number of rows per value)
- Modification Counter (MC) = 150 (number of modifications to the table since the last stats update)
- Adjusted Cardinality (AC) = TC + MC
The Demo Case
One of the first things this calculator does is to calculate AR (often referred to as the “density vector”). This can be seen by attaching a debugger to the SQL Server process:
00007ffc`a11f4853 410f28fa        movaps  xmm7,xmm10
00007ffc`a11f4857 f20f5e7868      divsd   xmm7,mmword ptr [rax+68h]
This code:
- moves the contents of CPU register XMM10 (TC, or 300 in this test) into XMM7,
- divides that by a value stored in RAM (DV, or 3 in this test), and then
- stores the result back into XMM7 (AR, or 100 in this test).
You can see these values by interrogating the different registers and memory locations:
0:055> r xmm10:d
xmm10=                     0                    300
0:055> dD 1E3D620B628  L1
000001e3`d620b628                       3
0:055> r xmm7:d
xmm7=                     0                    100
Now that we have AR, the code checks to see if MC > AR. In this case, it is. MC is then added to TC to produce the AC of 450 rows.
At this point, the code takes the square root of AC, which is 21.2132034356:
00007ffc`b2a39ed1 f20f514c2460    sqrtsd  xmm1,mmword ptr [rsp+60h]
...
0:055> dD BDECA75EA0  L1
000000bd`eca75ea0                     450
0:055> r xmm1:d
xmm1=                     0          21.2132034356
This process of using the square root to produce an estimate is something common in the new cardinality estimator called “exponential backoff.”
After the square root has been calculated, it is compared to the AR. 21.2132034356 is less than or equal to 100, so the selectivity (from the XE above) is calculated as SQRT(AC) / AC which is 0.0471404520791.
Other Cases
There are a lot of branches in this calculator. As far as I can tell, in the “happy path” for this calculator, there are three possible estimate results:
SQRT(AC)ARMC
Which one is chosen is based on the following logic:
Estimate = MIN(SQRT(AC), MIN(AR, MC))
Note that if statistics are sampled, then MC is not considered. So the formula becomes:
Estimate = MIN(SQRT(AC), AR)
I use the phrase “happy path” above because there are some guard clauses and other branches in this code I never managed to hit. Presumably these would either cause an error, or result in the calculator “failing” as the CSelCalcColumnInInterval does in this example.
Exponential Conclusion
Under the 2014+ cardinality estimator, SQL Server uses an exponential backoff approach to deal with the ascending key problem. Depending on various factors (table size, modification count, distinct values, and sampled vs fullscan stats), queries above existing histogram ranges will result in an estimate of
- the square root of the table cardinality,
- the number of modifications to the table since stats were updated, or
- the density vector of the column
I’m certainly glad to have sorted this out, with awesome help from the folks in the SQL Server community, and I hope it helps you all out there in blog-reading land!